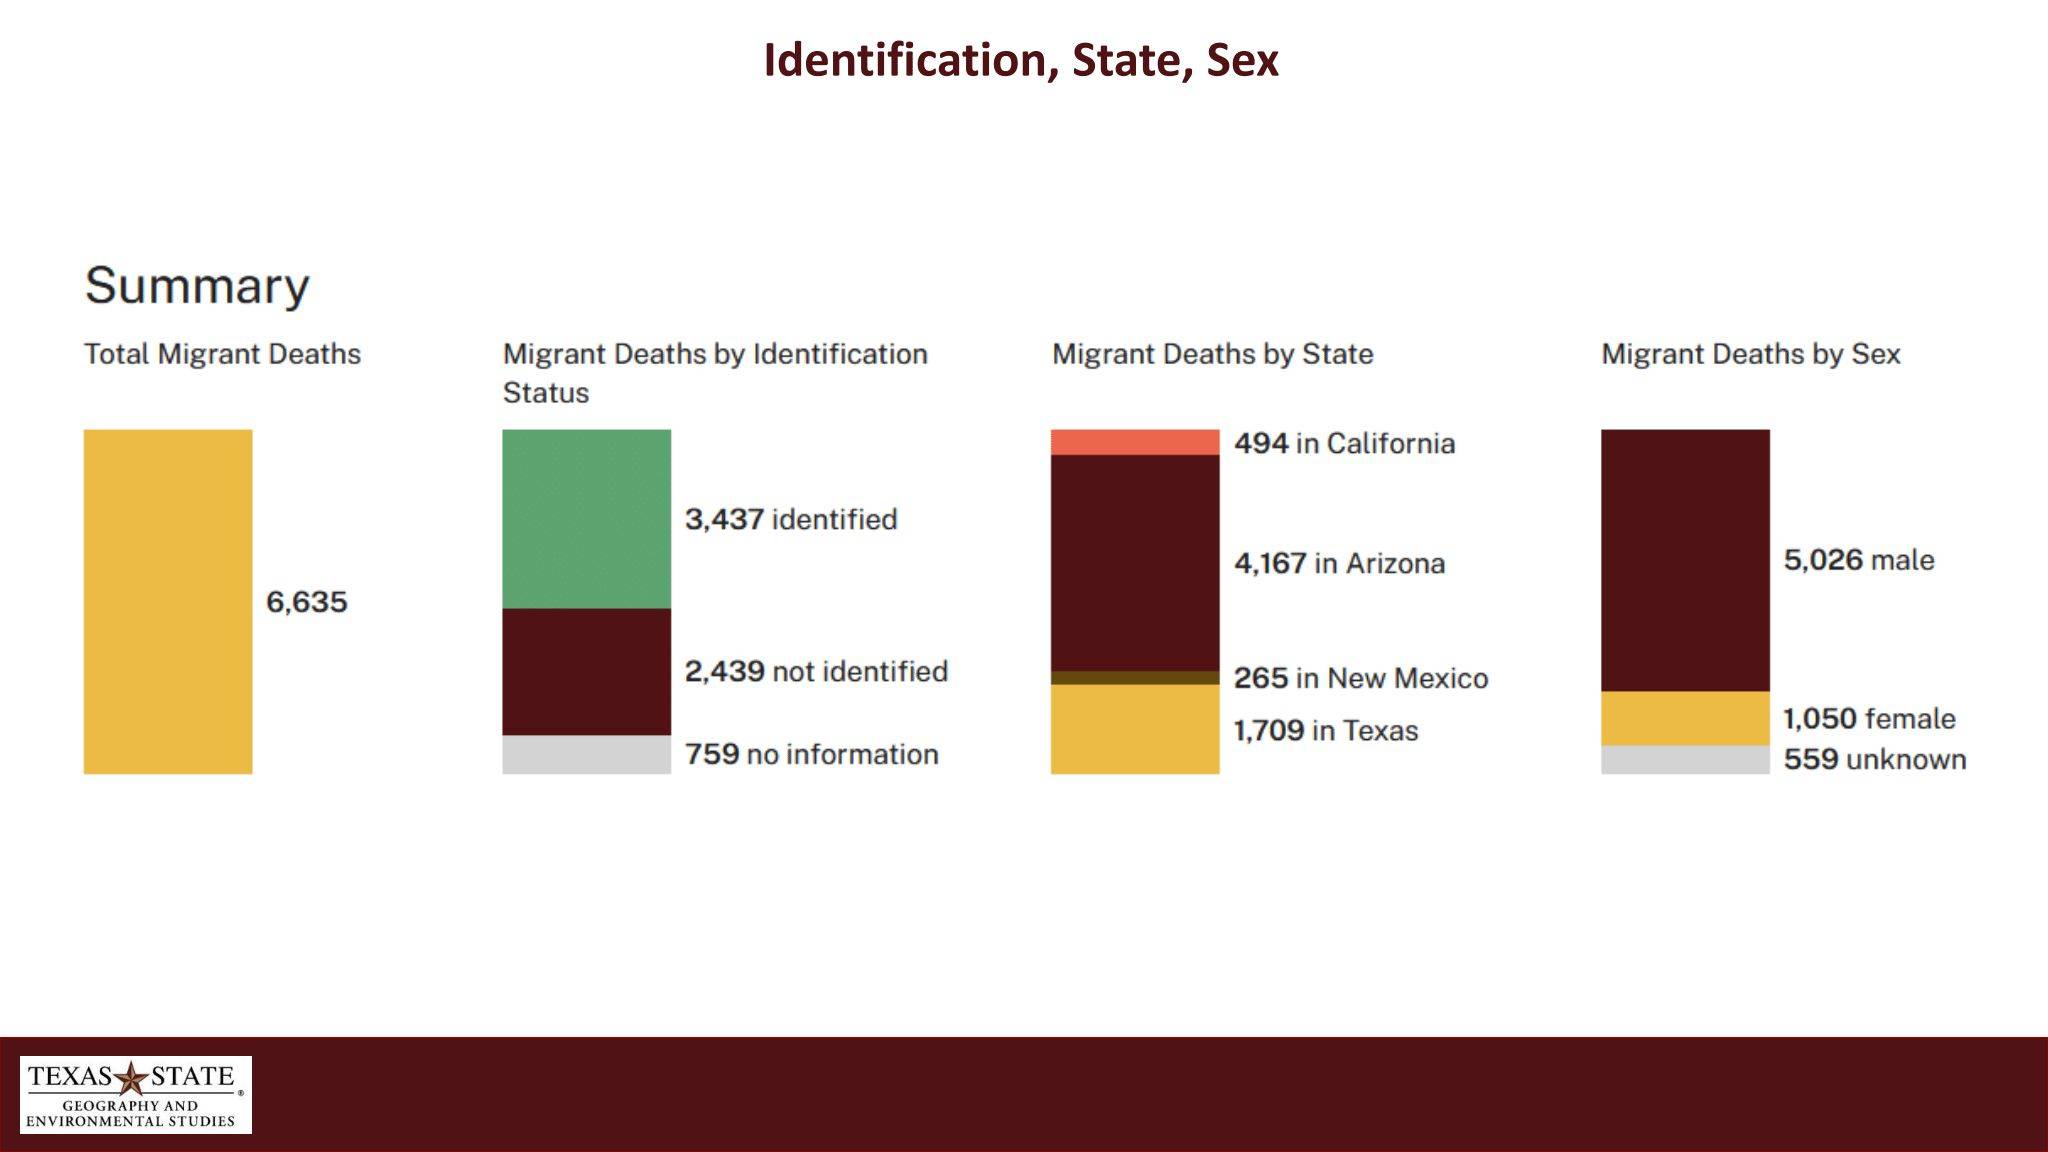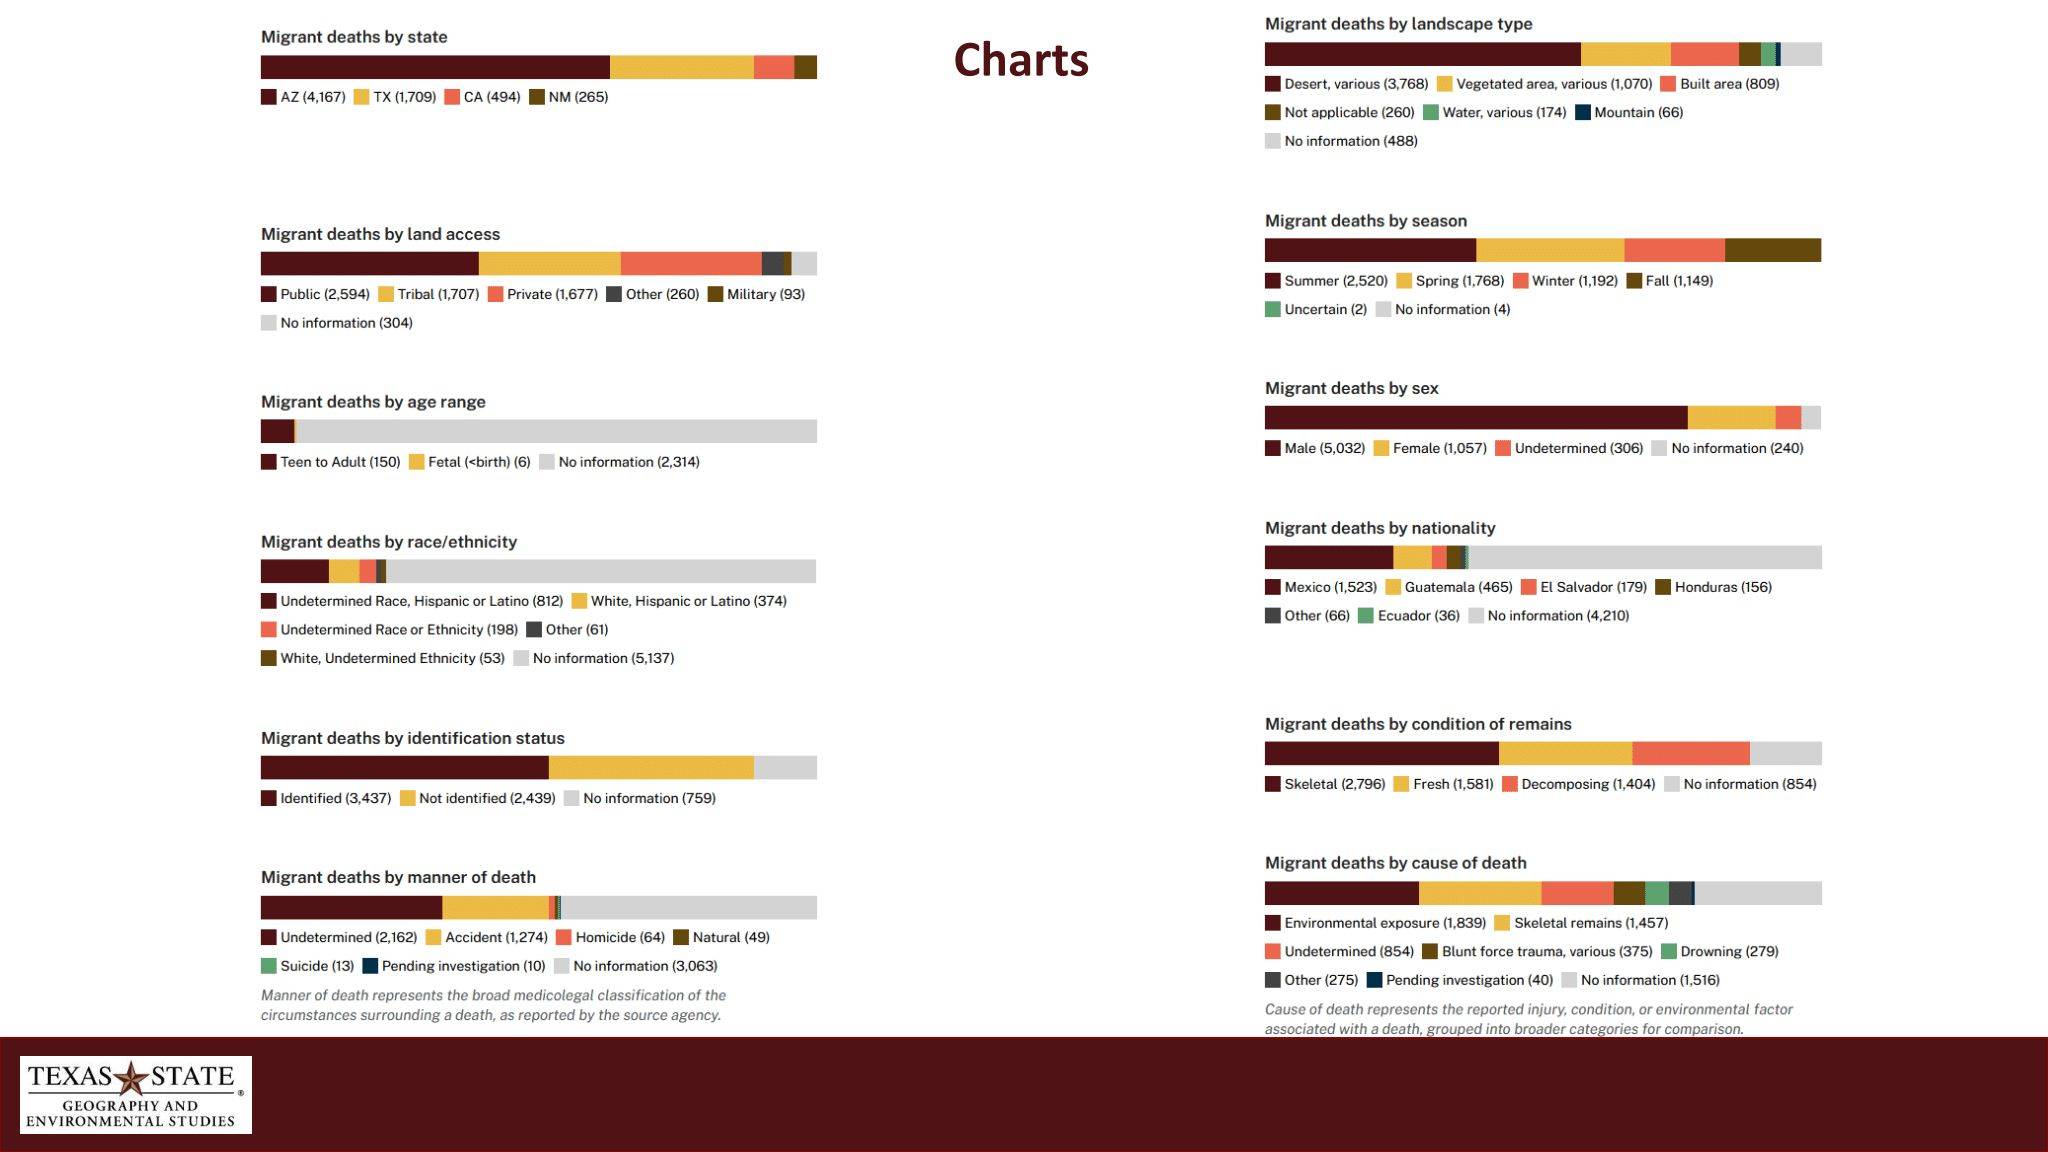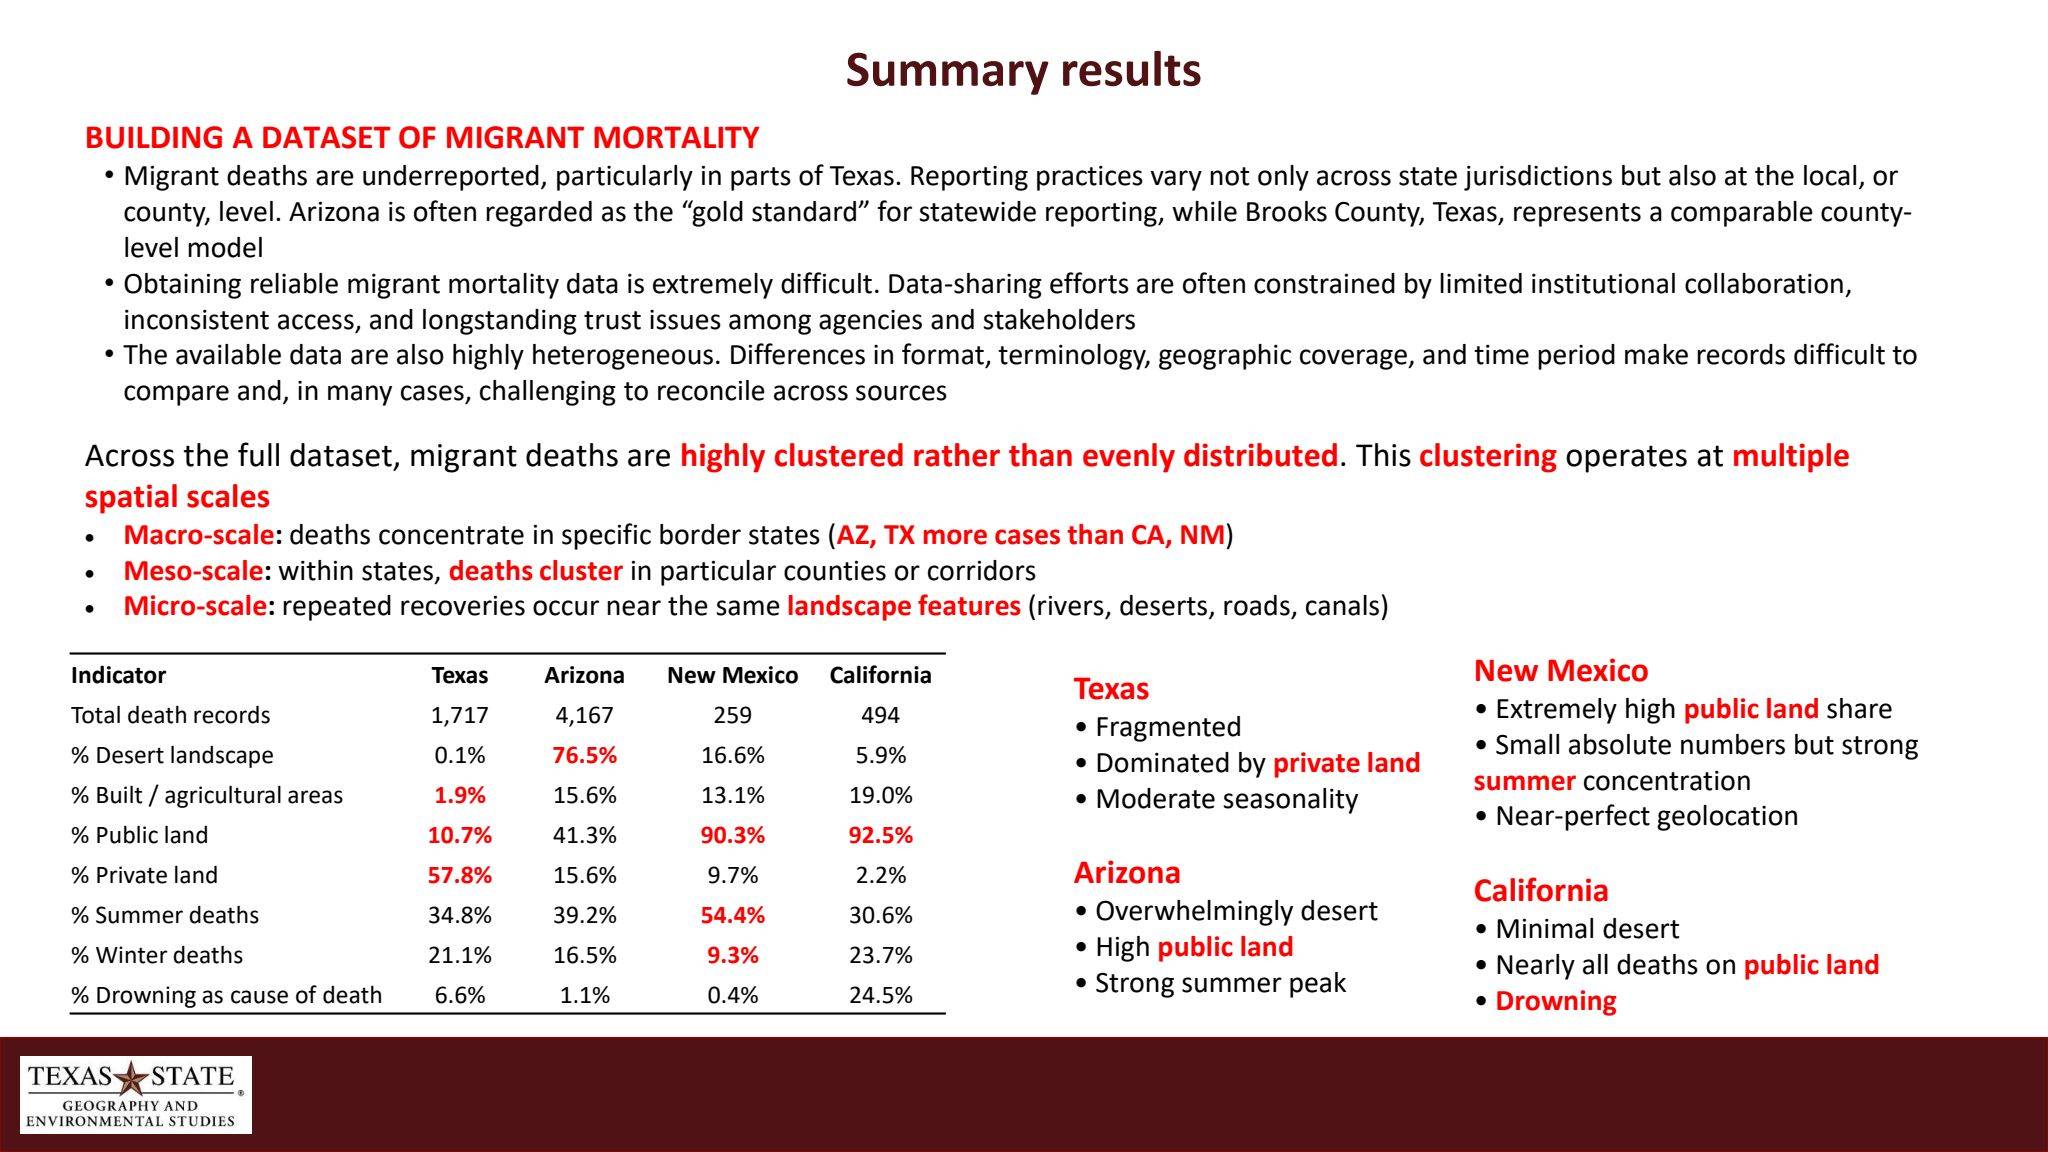


Summary of Research Results
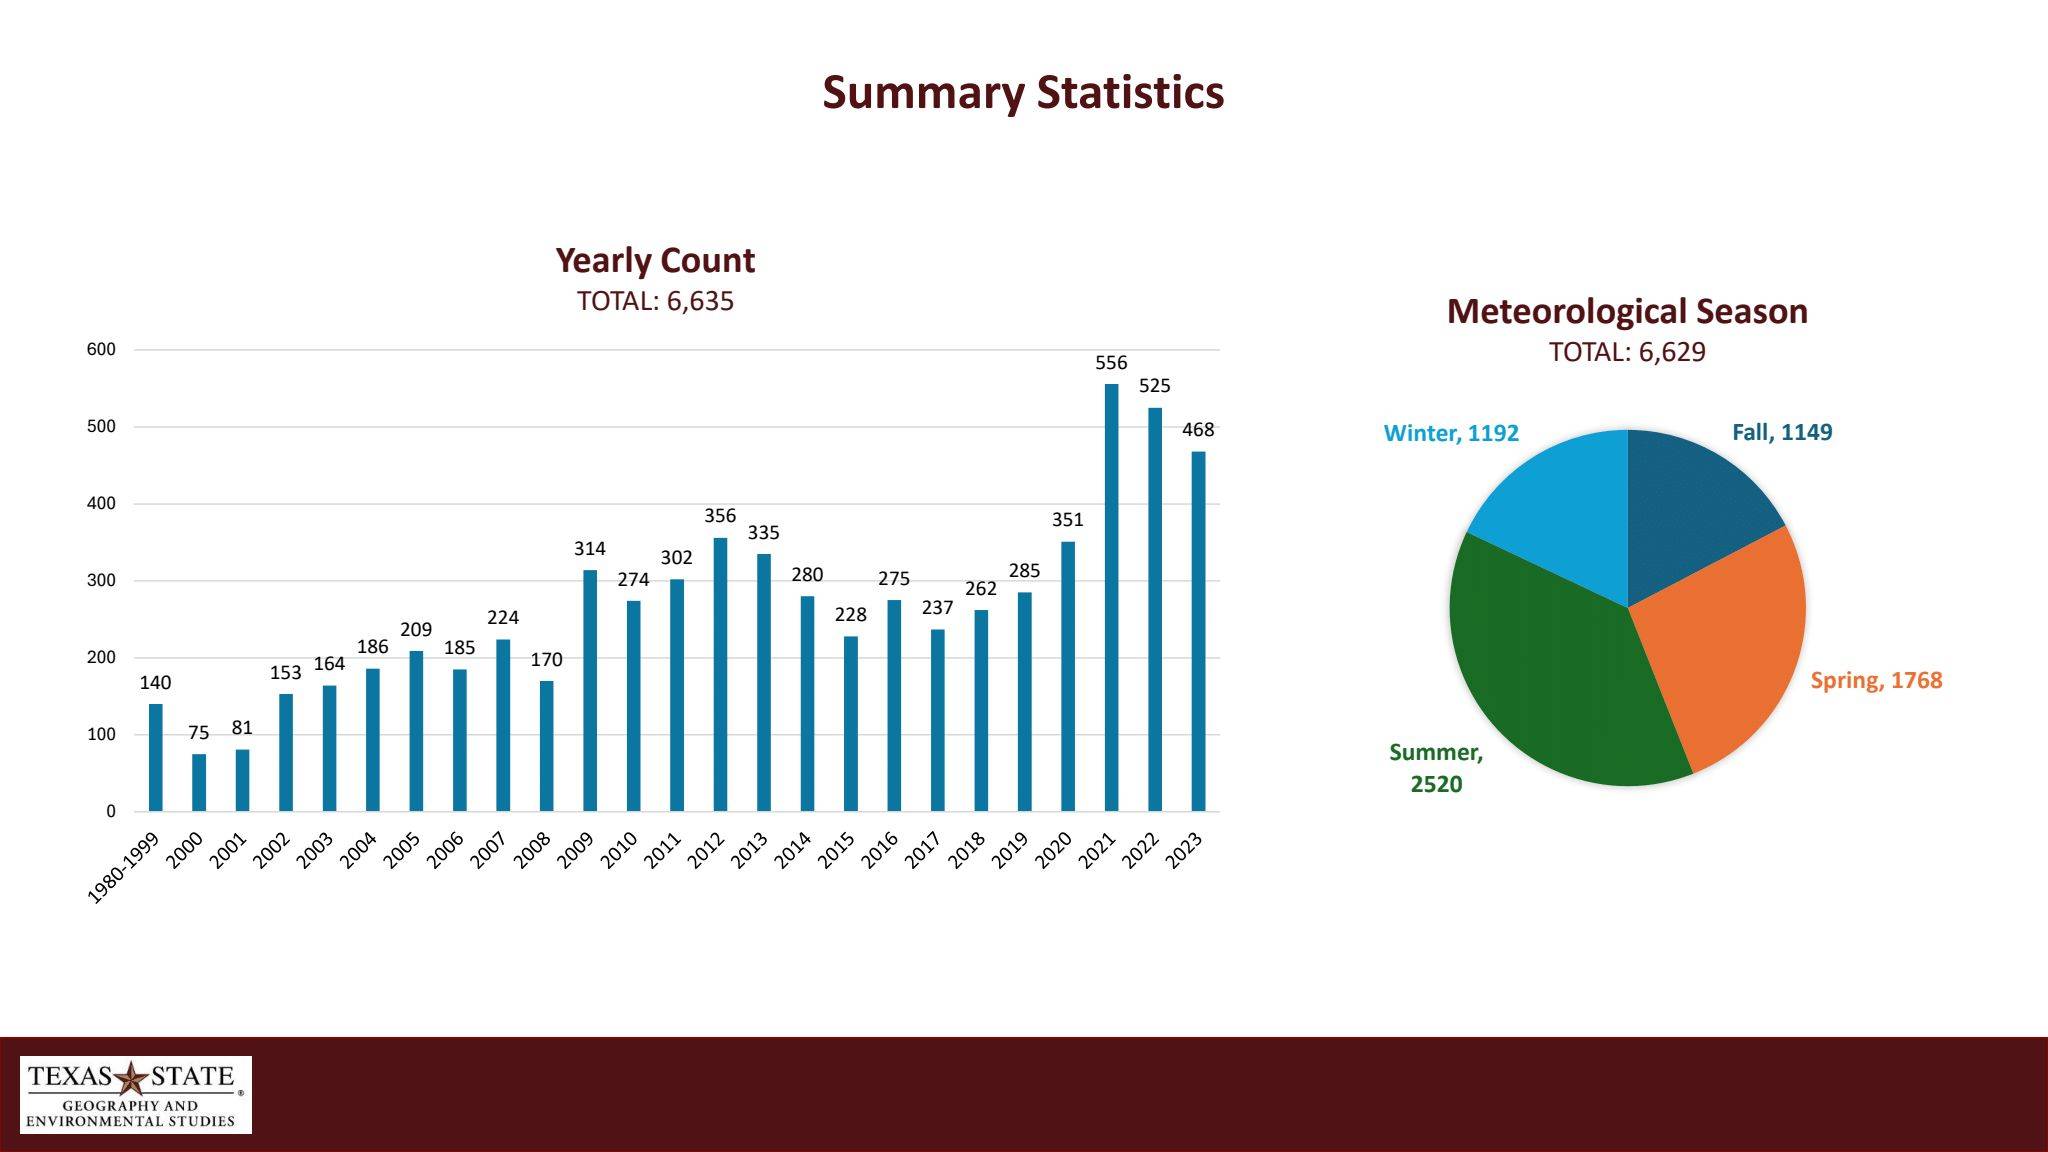
Introduction to analyses by the M3P2 team. Selected analyses are viewable below as images or download the full report in PDF format. Discussion of results as of August 2026.
M3P2_Summary_Results_16Oct2026
(PDF, 14.2MB)
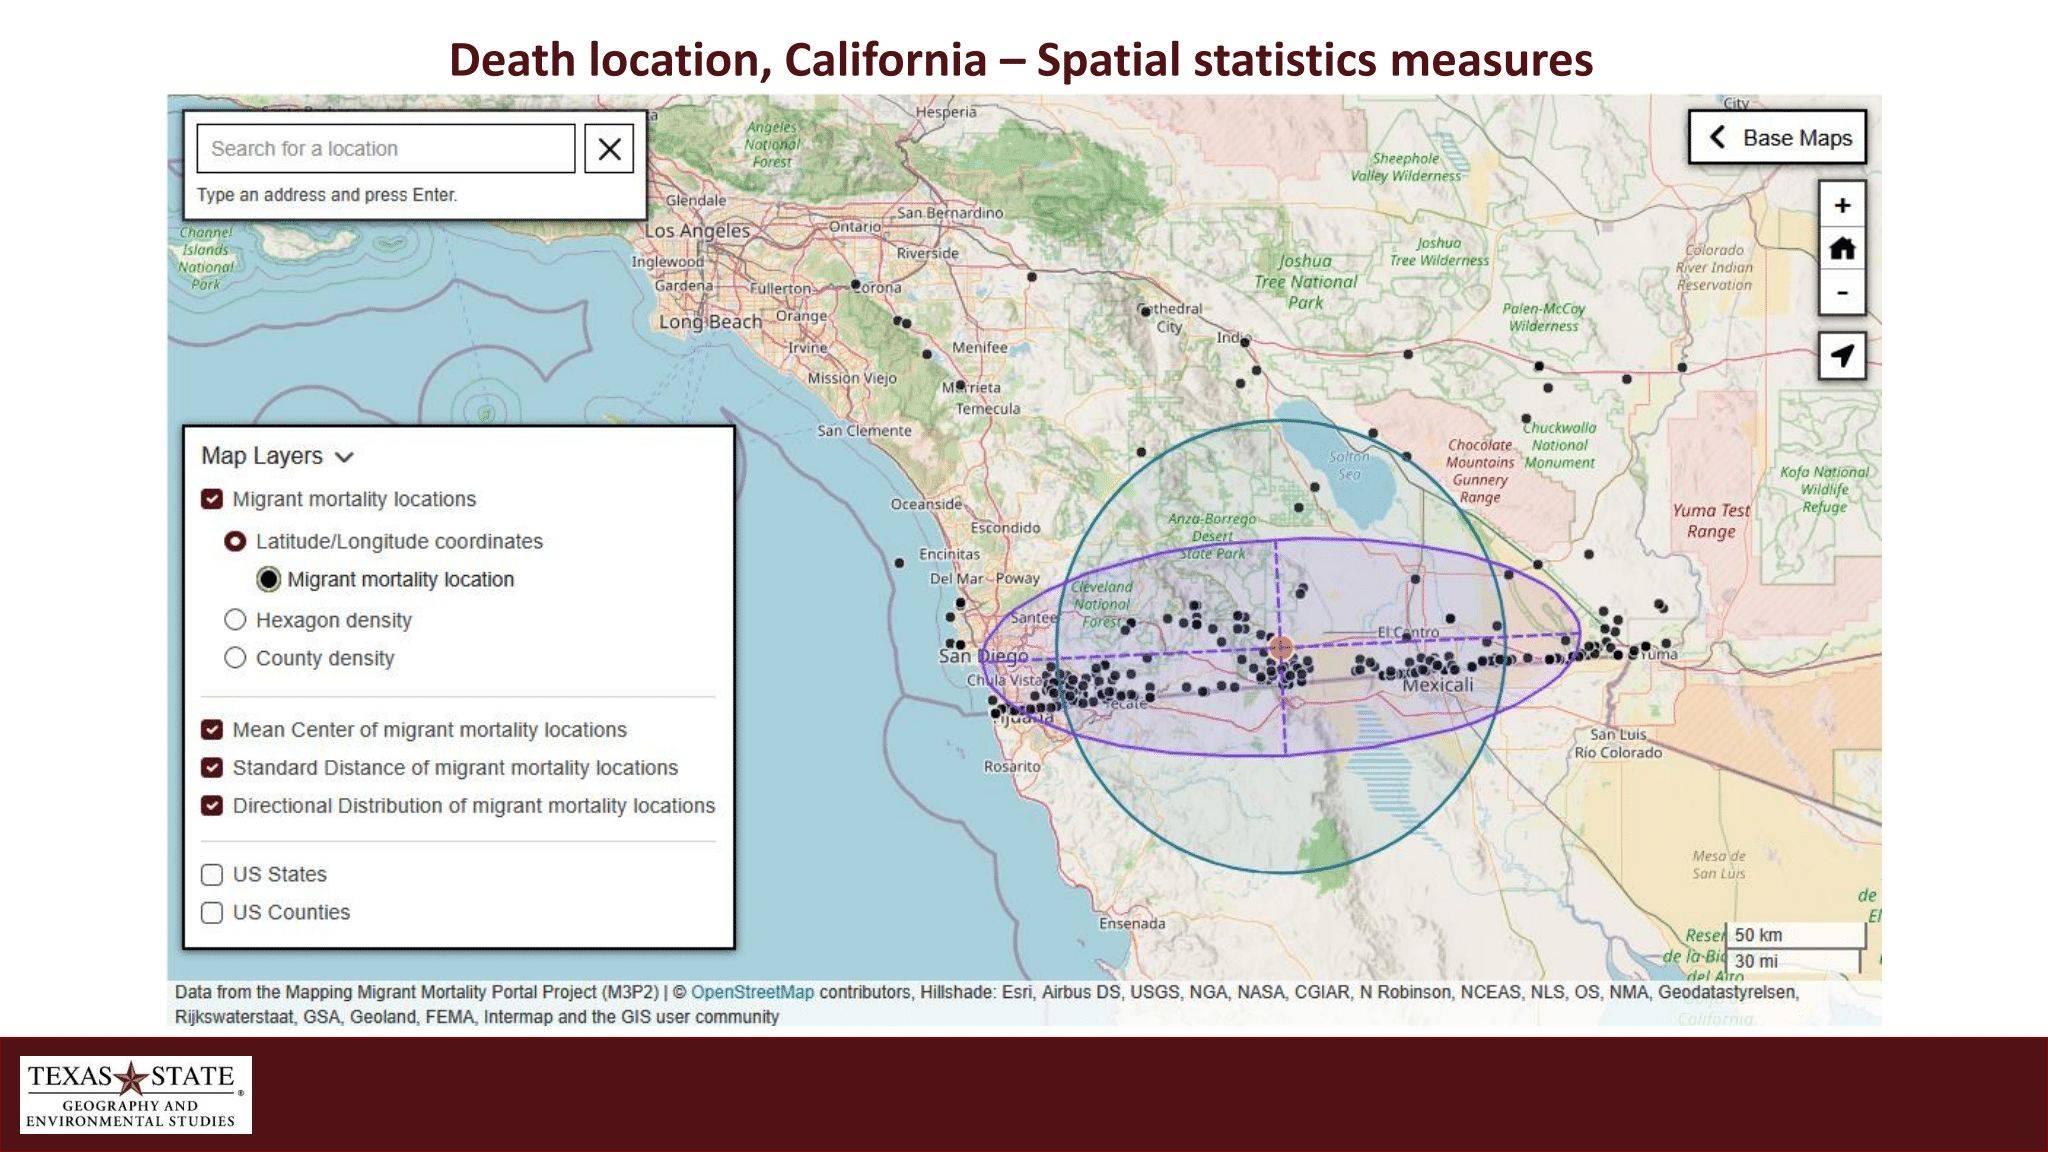
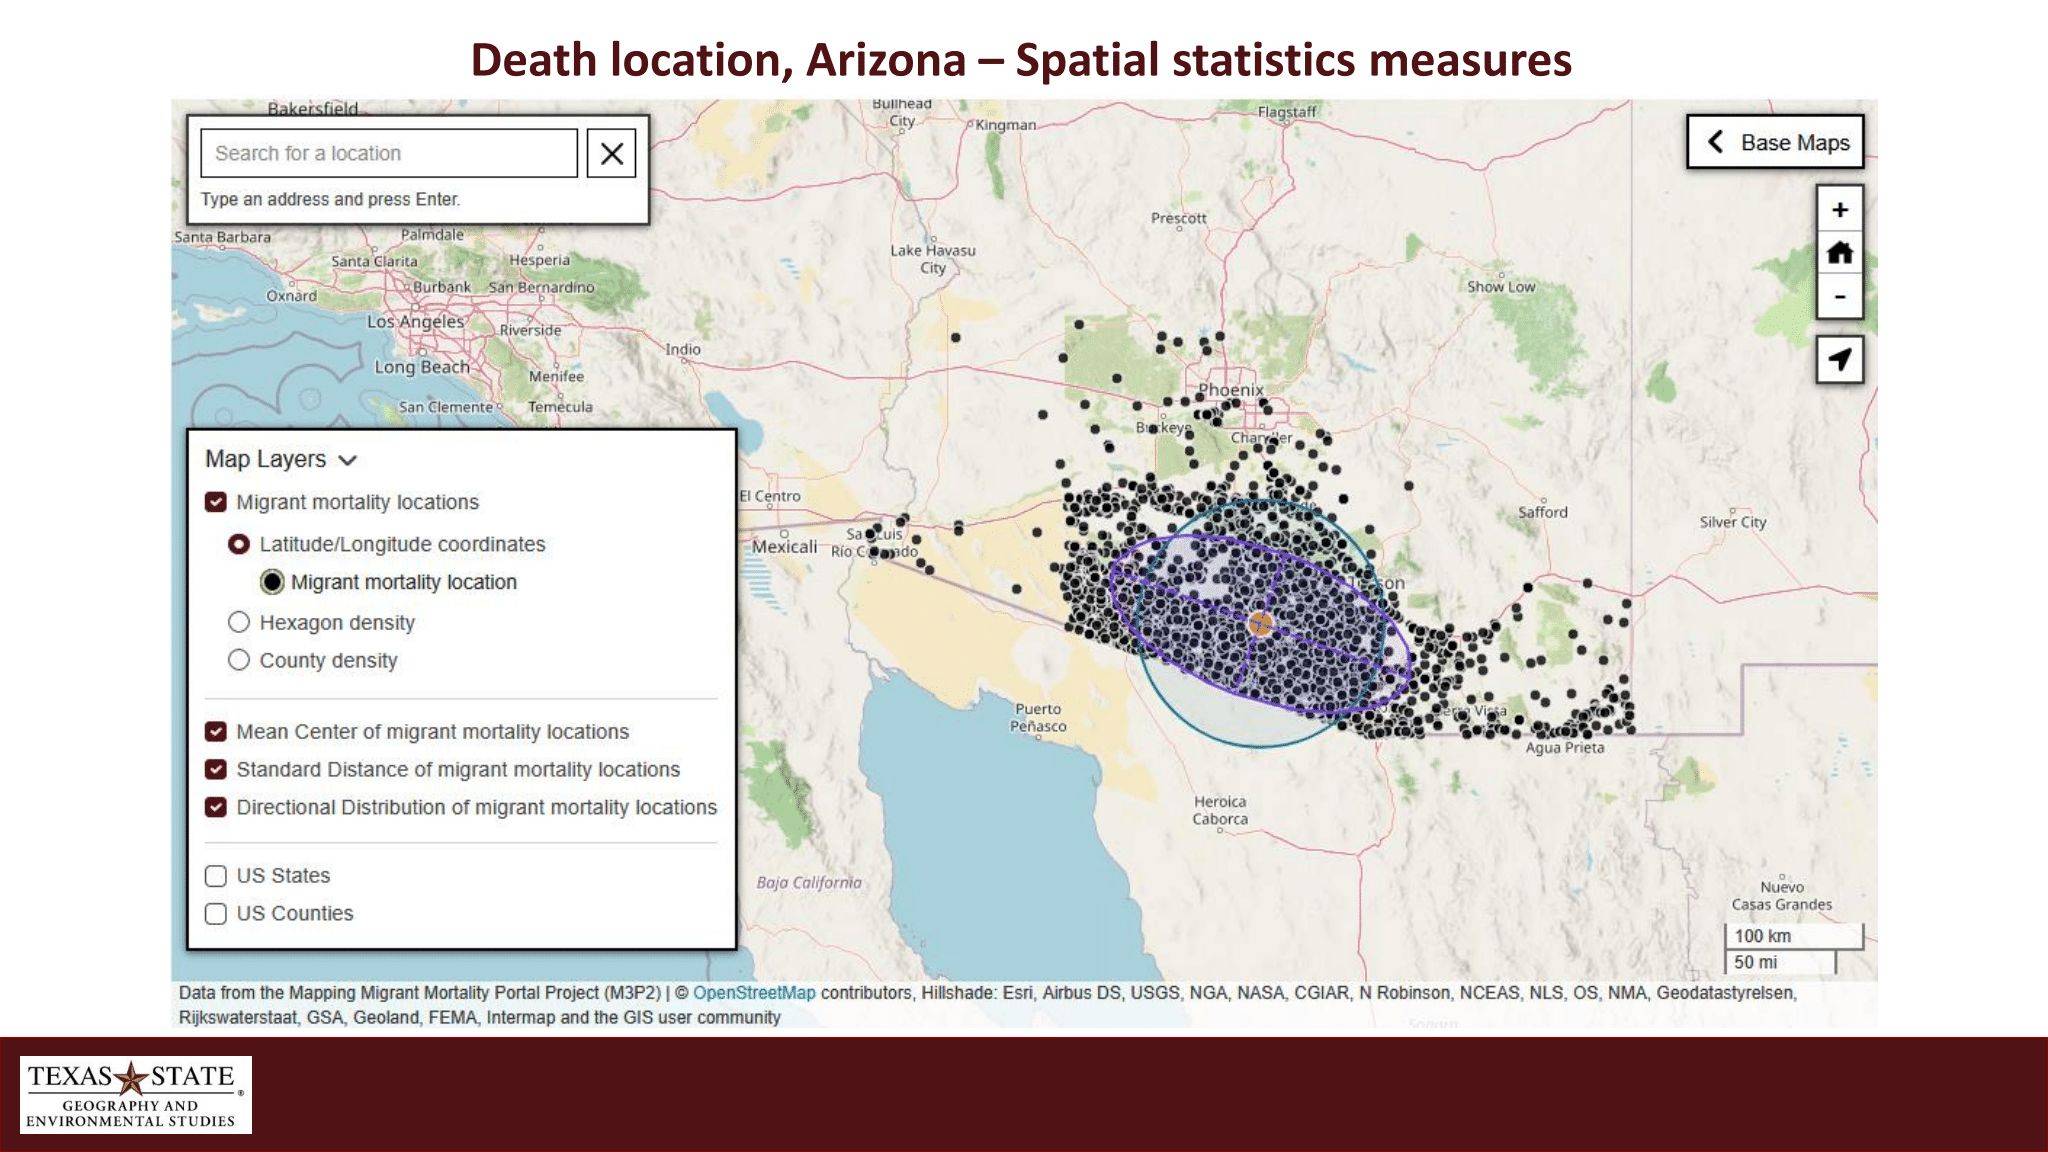
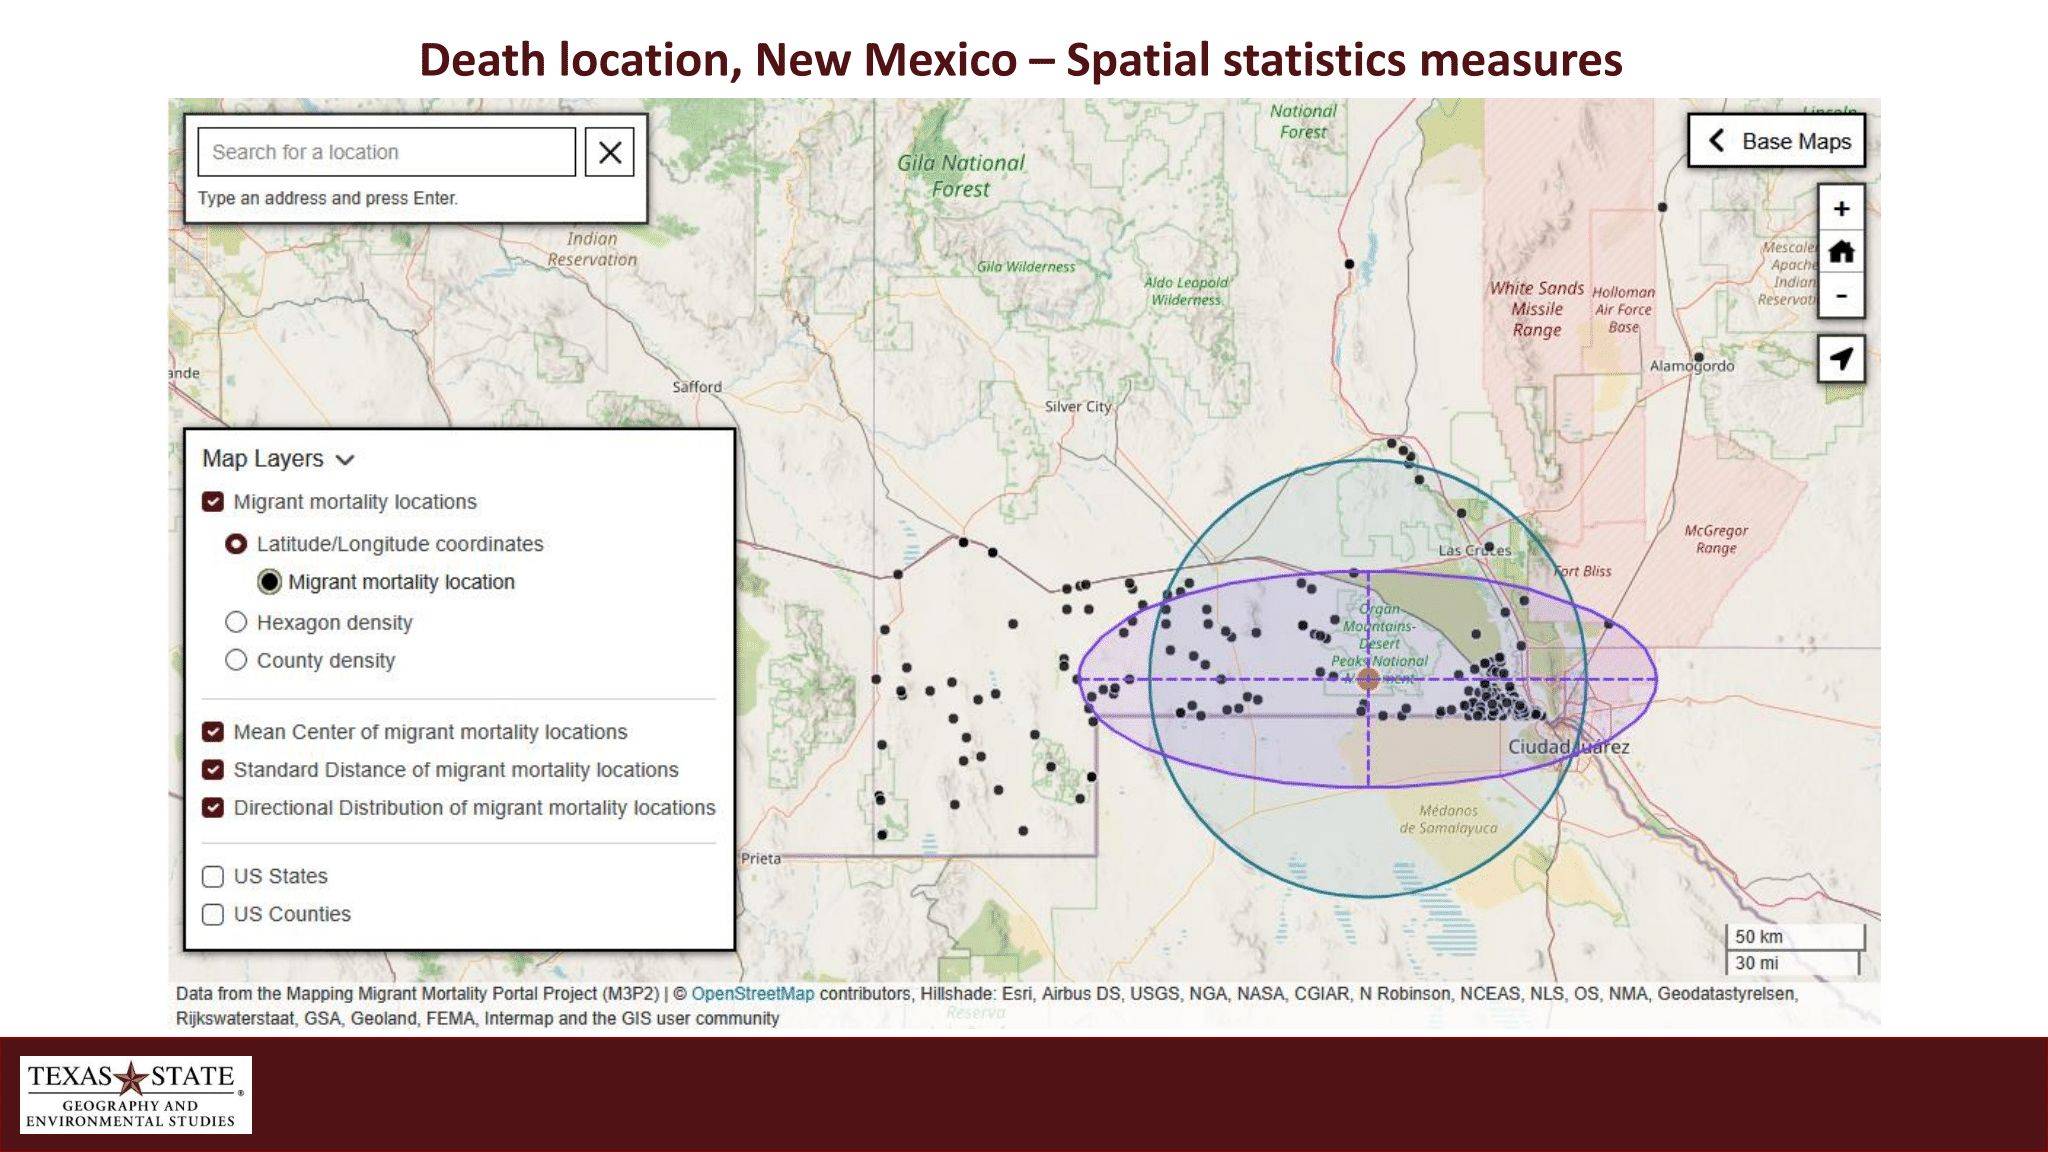
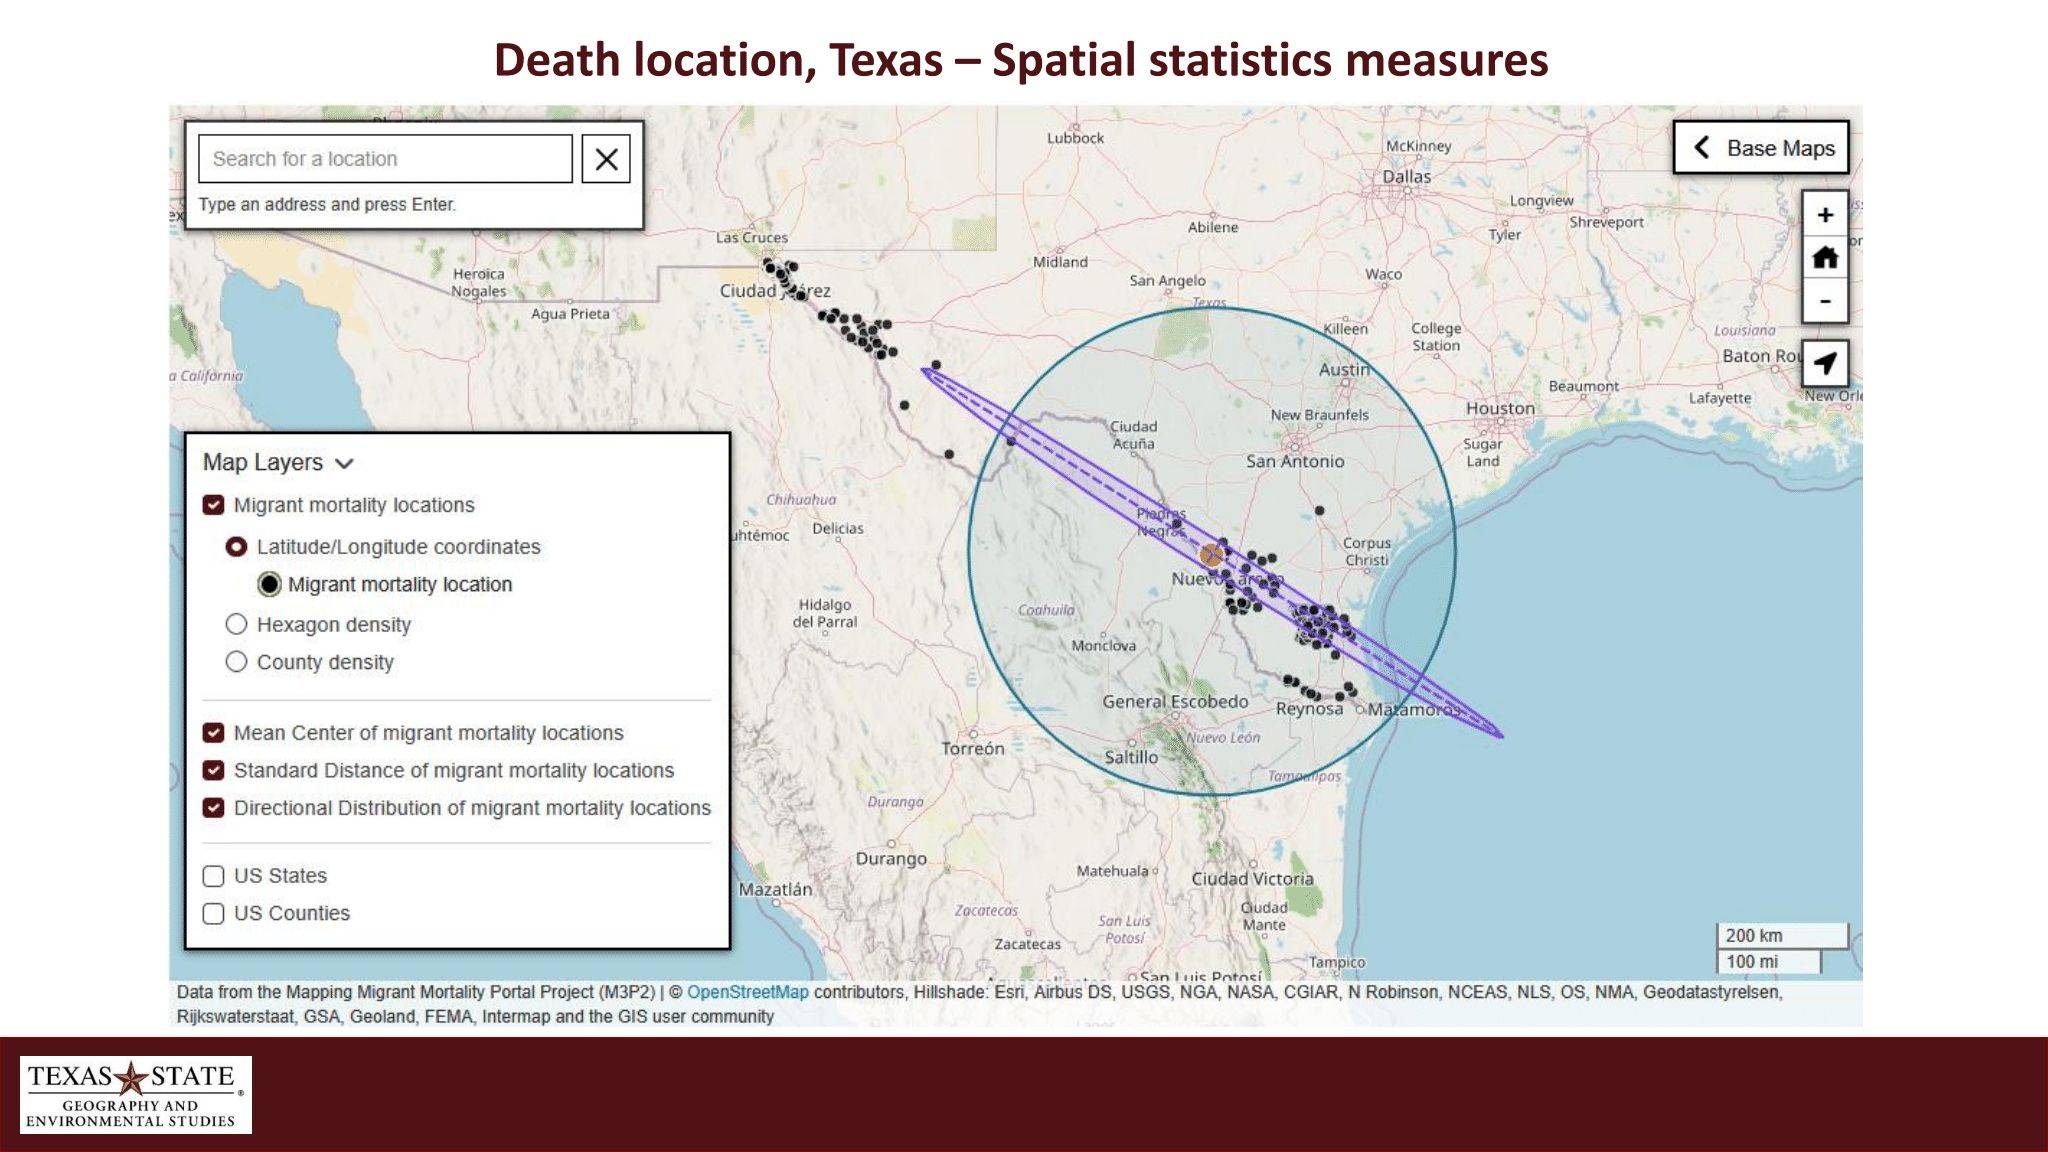
Summary Spatial Statistics - Mapped Analyses by State
Summary Statistics - Charts by Category